PB-005 · Personal Build
Stock Scanner
Unified app to track and manage equities in multiple currencies.
2022 · Python · UI/UX
Overview
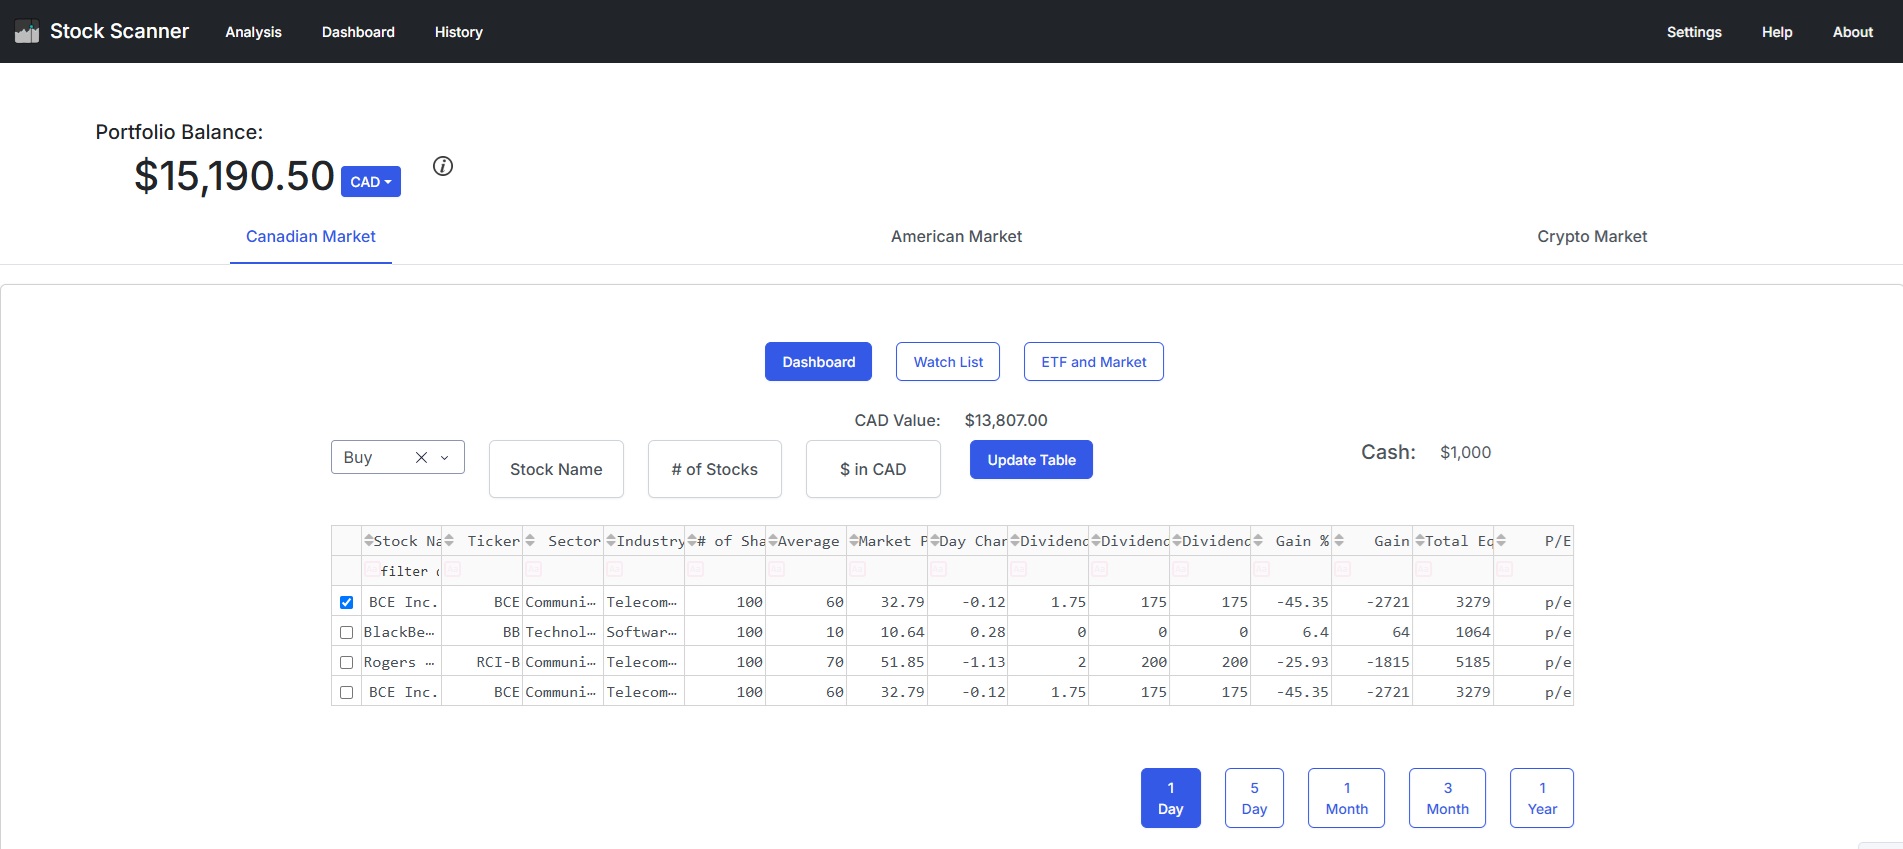
This side project was designed because some web brokers do not unify holdings together, and keep everything separated by account (CAD vs USD).
Design
After learning about Dash Plotly during one of my internships, I wanted to explore its features more and design a web app that I could use for stock tracking. This interactive web app was completely written in Python with packages such as yfinance for data scraping, Dash for UI and Plotly for graphing.
Results
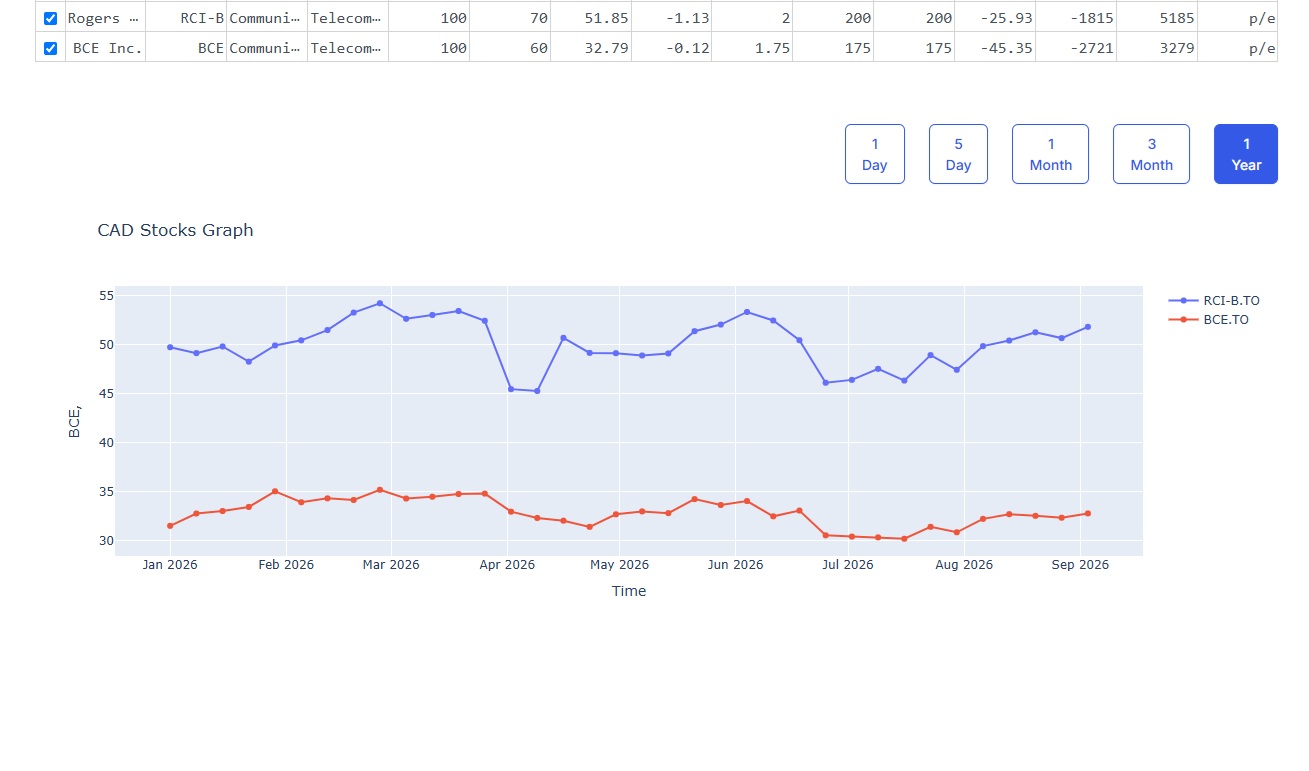
While ambitions for the app were high, including stock analysis and net portfolio gains, many of those features had minimal implementation or were never implemented at all. A variety of problems were present: yfinance would update frequently and break scraping features, load times were slow when more than 5 stocks were added (lots of data was downloaded), and time was limited during the school year. If I were to make this again, I would try another package instead of yfinance to prevent constant breaking. Although some data was cached and data acquisitions were simplified, constantly downloading all stock data each time the page was refreshed slowed down the interface. I would log data like the industry once and save historical prices so that only new data needed to be acquired. This project was not a waste though, as it taught me dataframe management and honed my skills in Python. Both of those have helped me to this day.